Predictive Analytics with Prescription Drug Management
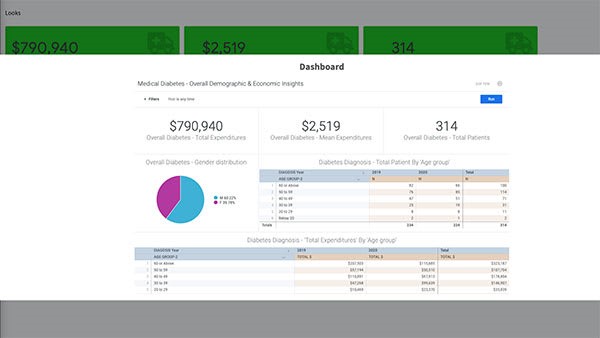
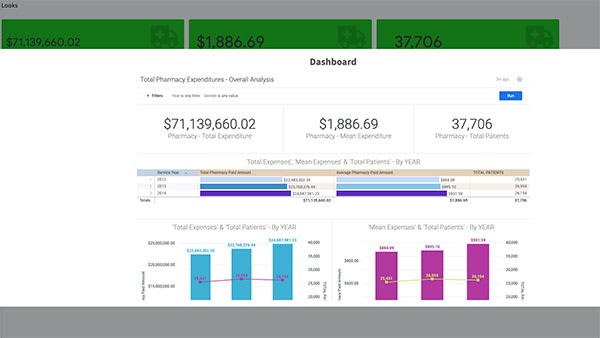
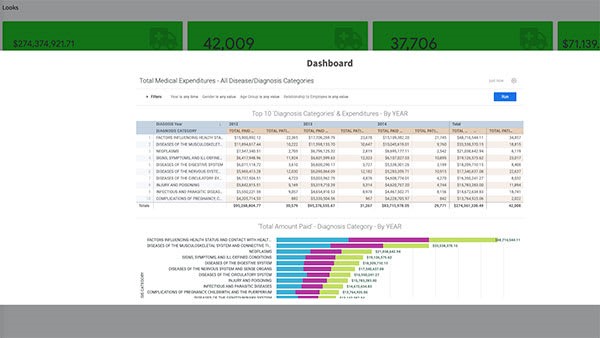
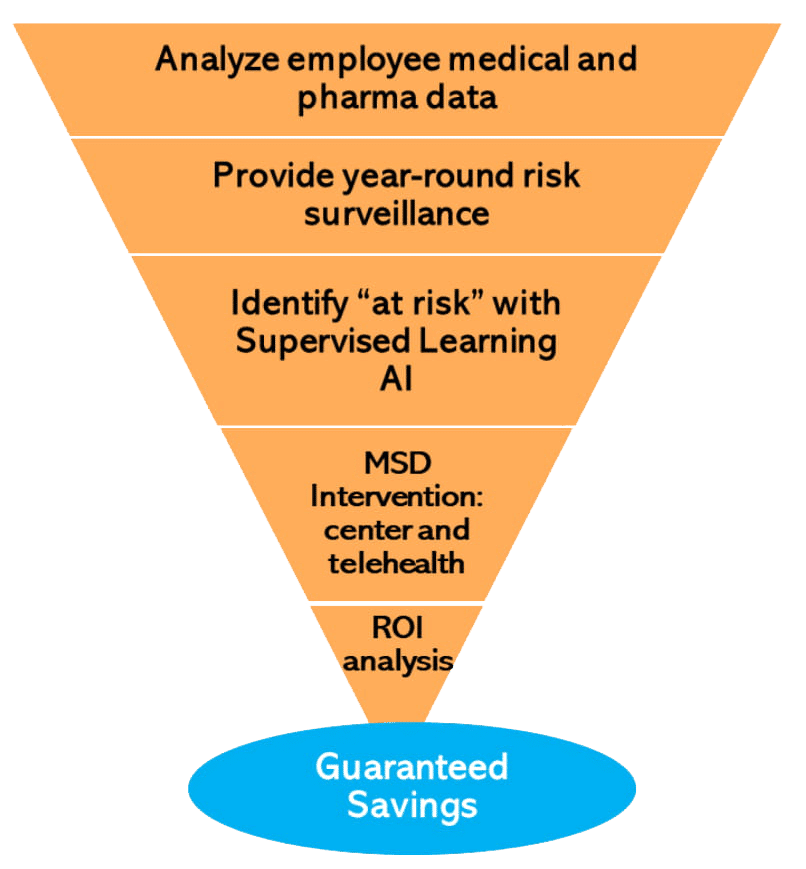
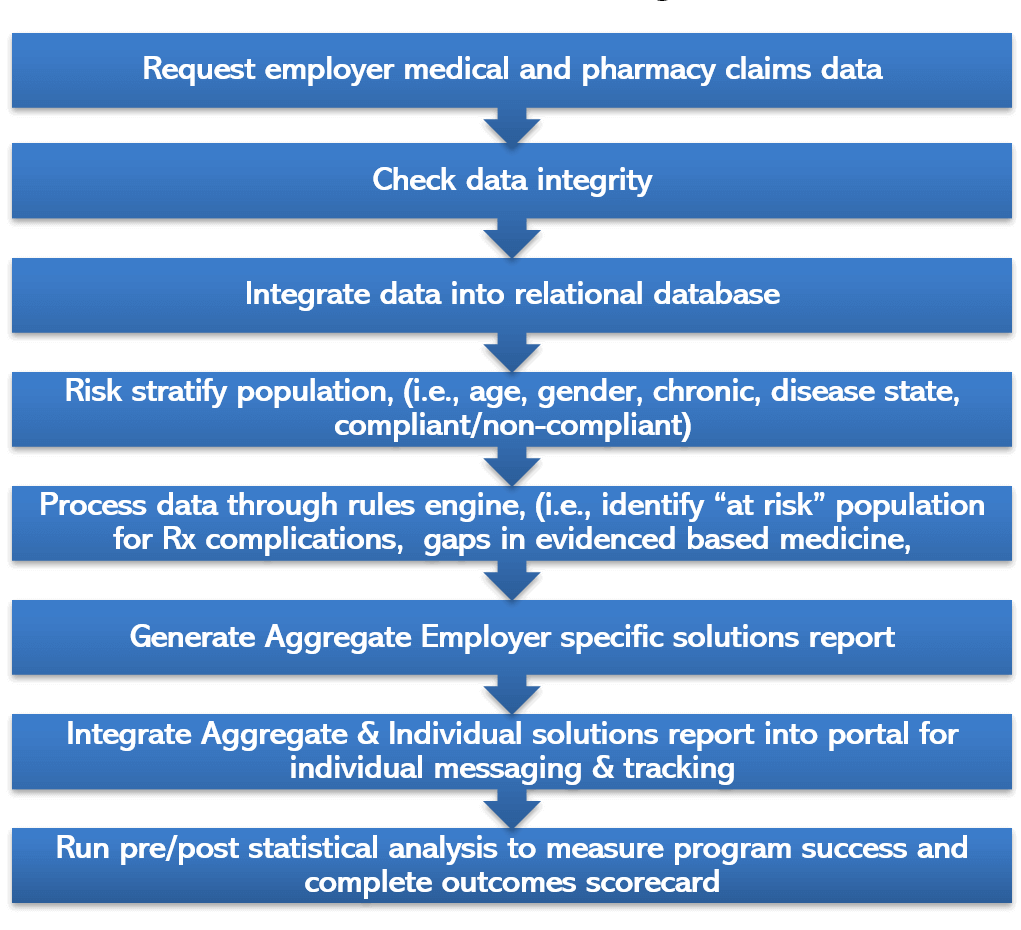
The M.R.S. analytics system intakes ongoing medical and pharmacy data to provide year-round risk surveillance of the employer population, in order to intercept risk migration and act promptly. The M.R.S. analytics system utilizes pre-established algorithms in combination with supervised learning AI (Artificial Intelligence) to segregate the “at risk” population. Financial savings and condition stabilization will be the targeted dependent variables for actuarial and outcomes reports. Annual ROI (Return on Investment) analysis will measure program performance.
The M.R.S. Turnkey Process for lowering your Musculoskeletal spending
M.R.S. Data Analytics

M.R.S. Rx Prescription Drug Cost Reduction Program
The M.R.S. Rx solution is designed with the aim of delivering deep Rx discounts for Employers and their Employees. Our proprietary Evidence-Based Prescription Drug Management program can save up to 25% on medication costs.
We start with an initial evaluation of the employer’s Pharmacy Benefit and Utilization Experience. We review the Pharmacy Plan Design with a comprehensive evaluation of paid claims data to recommend improved Patient Care, Cost Containment, and Drug Coverage Strategies
As the next step we provide Ongoing Surveillance and Management of the Drug Pipeline and Pharmacy Benefits. We cover the new drug pipeline and existing drug categories including traditional pharmaceuticals and specialty drugs. We then coordinate with the health plan and with PBM (Pharmacy Benefit Managers) to incorporate recommendations into the plan design. Furthermore, we provide oversight to ensure that the claims process appropriately.
Overview of The M.R.S. Analytics Solution

Predictive Analytics
- M.R.S. Analytics system utilizes proprietary algorithms combined with supervised and unsupervised learning (Artificial Intelligence) to measure financial savings and risk reduction and stabilization. The system can predict future expenditures and calculate a Health Scores at an aggregate and individual level.
- Using AI (Artificial Intelligence) to segregate the “at-risk” population, the system can predict future risk and spend. Imagine taking 400 variables and, through strategic analysis and modeling, reducing it to 10 variables that are proven to drive future cost and/or disease risk.
Ad Hoc Query Tool
- The Ad Hoc Query tool allows users to answer various questions about their data, test hypotheses, and identify risk and cost drivers within the data. This is accomplished through advanced filtering capability of the data.
- The query tool provides the ability to filter against data variables from medical and pharmacy claims data (depending on availability of data imported to the system). Biometric data can also be integrated with claims.
- Algorithms are built into the system to map diagnostic codes (ICD10), procedure codes (CPT), drug codes (NDC), and other coding methodologies. This allows the user to search without requiring advanced coding knowledge or medical expertise.
- Each “query” can be exported to the user’s dashboard on the analytics platform, allowing the user to monitor various data points directly on the Dashboard without the need to run a separate report.


Cohort Analysis
- The analytics system provides the ability to run queries against two or more groups, in order to compare metrics between groups. Each group can be defined by specific independent and dependent variables.
- This tool is useful for running pre/post analyses on wellness programs and other interventions in place for an employer’s population

Including more than 25 specific reports/sections designed to provide insights regarding a customer’s population:
- Demographic Information (Age and Gender)
- Overall Medical Expenditures by Year
- Overall Medical Expenditures by Month
- Employee / Spouse / Dependent Medical Expenditures
- Gender-Related Expenditures
- Diagnostic Category Expenditures
- Chronic Disease Expenditures
- Diabetes Expenditures & Related Risk Stratification
- Diabetes Non-Compliance to Evidence-Based Guidelines
- Disease Group Risk Stratification Expenditures
- Expenditures Related to Lifestyle
- Modifiable & Preventive Utilization
- Lost Time & Cost due to Health Disparities
- Health Risk Projection
- Preventive Screening Compliance
- Value of Preventive Screenings
- Potentially Work-Related Musculoskeletal Expenditures
- Catastrophic Claims
- Inpatient, Outpatient, & Emergency Room Expenditures
- Avoidable Emergency Room Visits
- Primary Care Physician & Specialty Expenditures
- Overall Pharmacy Expenditures by Year
- Overall Pharmacy Expenditures by Month
- Employee / Spouse / Dependent Pharmacy Expenditures
- Medication Compliance
- Brand vs. Generic Medication Usage
Evidence-Based Rules report
Designed to monitor gaps in care, including compliance to age/gender-specific guidelines, disease-specific clinic guidelines, etc. Specific areas include:
- Individual gets diabetic test strips
- Individual gets diabetic test strips every quarter
- Individual has Emergency Room visit with no subsequent inpatient hospital admission
- Individual is in Disease Group 3 (i.e., diagnosis of at least one chronic disease)
- Individual is in Disease Group 4 (i.e., diagnosis of two or more chronic diseases)
- Individual is in Disease Group 5 (i.e., diagnosis of two or more chronic diseases and diagnosis of disease-specific complications)
- Individual is taking drug with cost greater than $400
- Individual is taking any drug included in Black Label Medication list
- Individual is taking any “specialty” drug
- Individual had Primary Care Physician visit
- If female, individual had breast cancer screening
- Individual had colon cancer screening
- If female, individual had cervical cancer screening
- If female, individual had HPV screening
- Individual has diagnosis of cardiovascular disease and is taking a Statin
- Individual had an Acute Myocardial Infarction and is taking a Beta-Blocker
- Individual has a diagnosis of diabetes and has been screened for a retinopathy
- Individual has a diagnosis of diabetes and is taking an ACE inhibitor or ARB
- Individual has a diagnosis of diabetes and is taking a Statin
- Individual has a diagnosis of hypertension and is taking anti-hypertensive medication
The report is produced in Microsoft Excel format and contains individual-level data identifying if the individual is eligible for each of the criteria and, if eligible, if each person is in compliance.


Analytics consulting
- Pre/post analysis of interventions and measurement of program outcomes
- Development of targeted, evidence-based intervention recommendations
- Review and recommendation of best-in-class vendor partners

